Salary Survey 2026: Stable earnings, limited raises, and evolving roles reshape the workforce outlook
For more than 19 years, Pool & Spa Marketing has conducted its annual salary survey to offer a detailed view of the people and businesses shaping Canada’s pool, spa, and hot tub sector. Alongside the publication’s annual state-of-the-industry report, which tracks residential pool permits nationwide, the survey offers a broader perspective on market activity and the workforce behind it.
This year’s findings examine experience, education, compensation, job satisfaction, business performance, and workplace trends across the pool, hot tub, landscape design/build, and retail segments. The results highlight a sector-balancing opportunity amid ongoing operational and economic pressures.
The findings point to an industry that remains engaged and adaptable, but not without challenges. Service and renovation work continue to support many businesses, while labour availability, rising costs, and broader market uncertainty remain key influences on sentiment.
General representation of the workforce
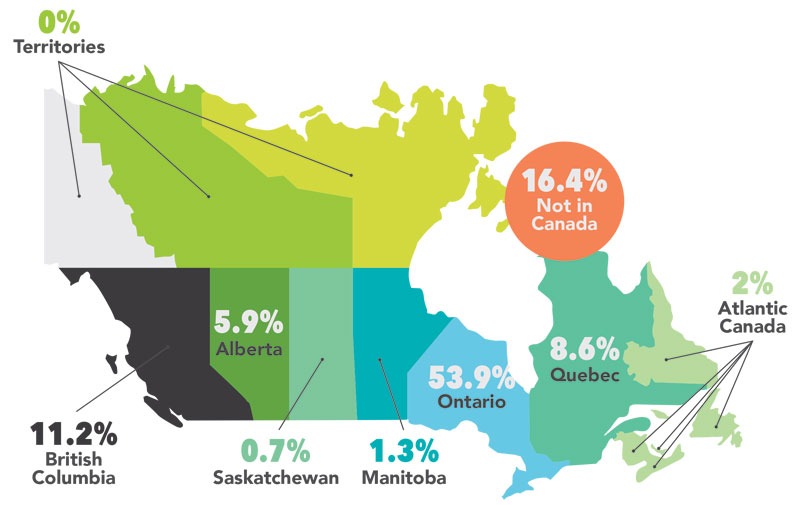
This year’s survey saw contributions from industry professionals across Canada, with Ontario providing the largest share of responses, followed by British Columbia and Quebec. While participation remained steady overall, Atlantic Canada experienced a notable decline.
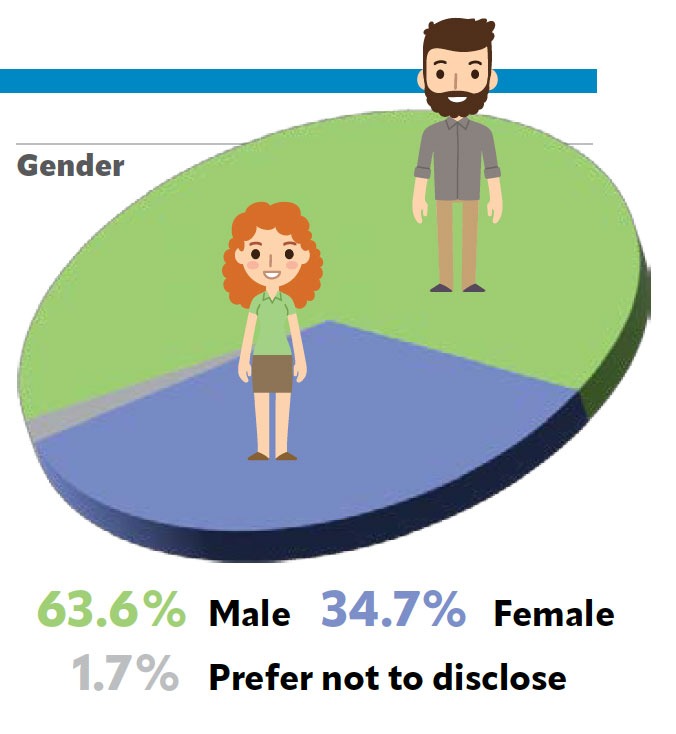
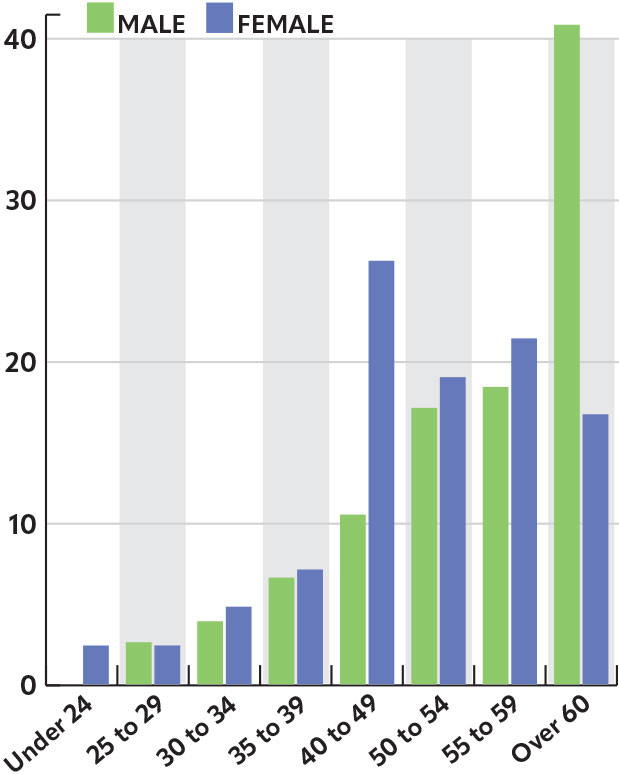
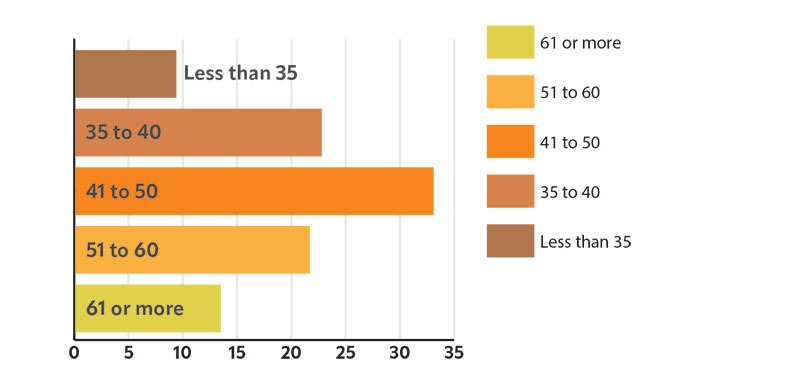
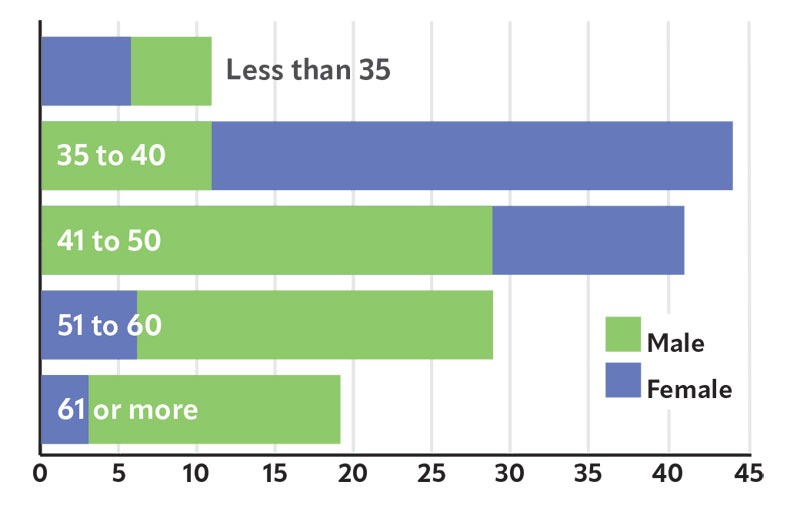
Gender representation shifted this year, with a decrease in male respondents and a corresponding increase in female participation, resulting in a more balanced respondent pool. The workforce remains seasoned, with over two-thirds of participants aged 50 and older, though there was a modest rise in younger respondents, particularly in the 35-39 age group. Female representation in younger age groups remains higher than that of males, though the gap has narrowed. Overall, while the industry leans towards experienced professionals, gradual changes in its age profile are emerging.
Career parths and retaining top talent
After years of growth, the percentage of respondents planning to leave the pool and spa industry in the next five years slightly declined from 19 to 17 per cent. This trend is more notable among male respondents. Meanwhile, the proportion of those expecting to stay in their current roles fell to 39 per cent, continuing a downward trend. However, the number intending to transition into sales, marketing, management, or consulting roles increased to 24 per cent, indicating greater career mobility within the industry.
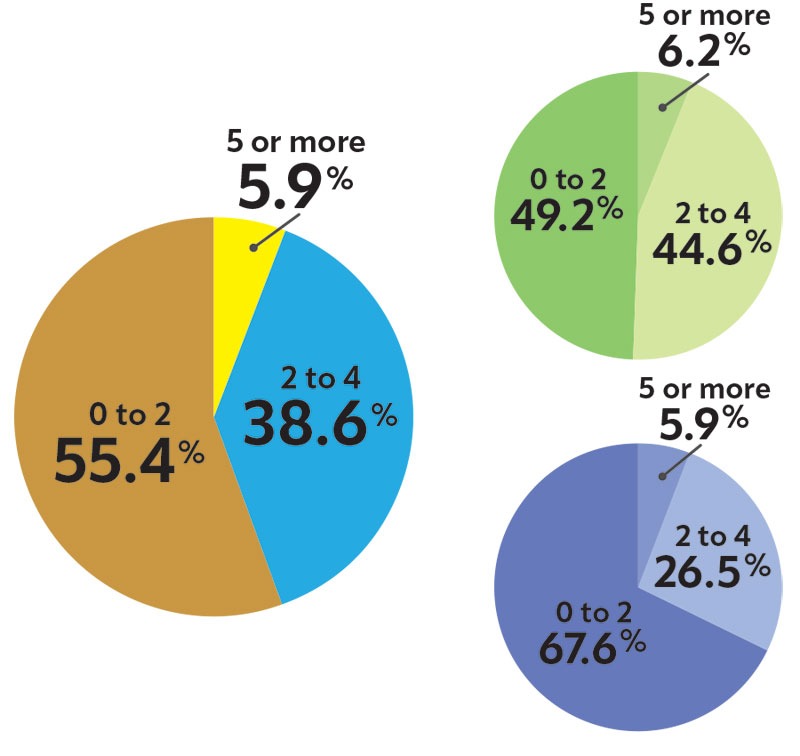
Despite these changes, most respondents still intend to remain in the sector. This ongoing commitment is encouraging for an industry that has often struggled with recruitment and retention, especially in peak seasons. Additionally, 10 per cent of respondents reported working for five or more companies, reversing a previous decline. In comparison, 60 per cent have worked for just one or two, showing some workforce movement, but a stable core remains.
Who is shaping the industry today?
Pool & Spa Marketing connects professionals in the pool, spa/hot tub, and landscape sectors with timely news, product updates, and best practices through its print publication and Waterlines e-newsletter. It reaches builders, contractors, service technicians, landscape architects, retail managers, manufacturers, and suppliers.
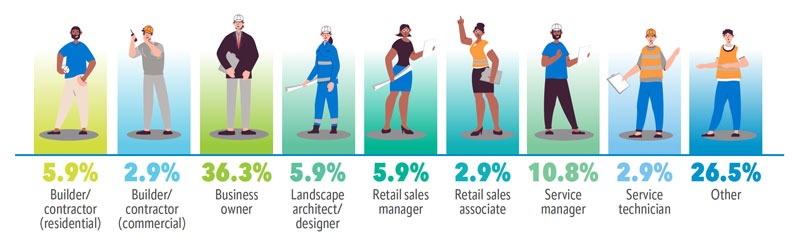
For the 10th consecutive year, business owners represent the largest respondent group. While this segment remains dominant, there are modest shifts: participation from service technicians and retail sales managers has increased. At the same time, representation among residential and commercial builders/contractors has slightly declined, as has that of landscape architects and designers. This trend indicates a growing focus on service, retail, and operations roles within the industry.
Salary growth trends
Compensation in the pool and spa industry shows a diverse range of roles and responsibilities, with a notable concentration in mid-range salaries. This year, 60 per cent of respondents reported earning between $60,000 and $149,000, and 34 per cent earned more than $100,000, although these figures indicate less robust upper-end representation compared to previous years.
Overall salary growth has slowed, with 43 per cent of respondents receiving no raise and 41 per cent reporting modest increases of one to five per cent. Only a small percentage saw raises exceeding 10 per cent, highlighting a trend of limited wage growth.
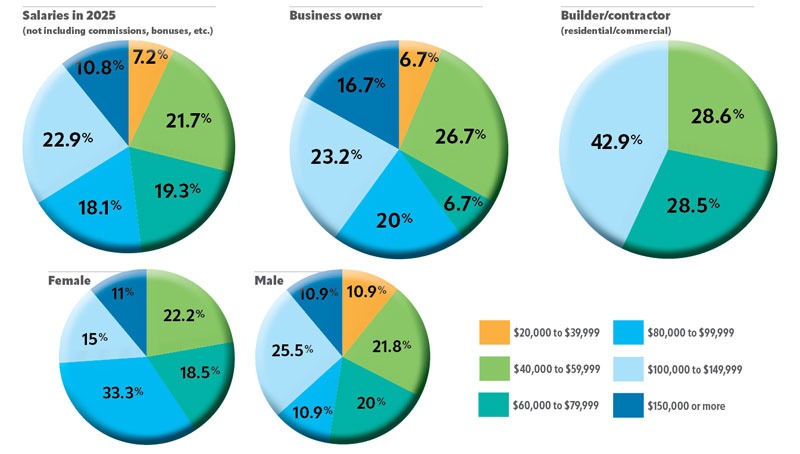
Demographically, males were more likely to report no salary increase, while females experienced smaller raises. Business owners often reported stagnant compensation due to cost management pressures. Interestingly, those with industry training enjoyed slightly better wage growth.
In summary, while compensation remains steady, upward movement is constrained, reflecting broader economic pressures affecting salary adjustments across the industry.
Hands-on learning remains essential
This year’s survey shows a continued rise in formal education among respondents, with 94.7 per cent holding a degree. However, only 5.3 per cent reported their education is directly related to the pool and spa industry, revealing a gap between academic qualifications and industry-specific training.
The distribution of education levels shifted, with fewer respondents having some college education without a degree, while those with a high school diploma or equivalent increased, resulting in a more even split between the groups.
Industry training participation presents a mixed picture. Manufacturer and dealer training rose to 58 per cent, and Certified Pool/Spa Operator (CPO) certification reached 39 per cent, indicating a gradual recovery. Conversely, participation in association-led education declined, with those taking PHTCC training dropping to 28 per cent and PHTA education falling to 18 per cent.
Training trends varied by role: business owners and builders/contractors showed higher participation in CPO certification, while manufacturers adopted training universally. Overall, the findings emphasize that despite a highly educated workforce, there is a lack of formal training aligned with the pool and spa industry, necessitating a continued reliance on hands-on learning and manufacturer-led training.
Key shifts in work dynamics
Employment patterns in the pool and spa industry remain largely stable, with full-time, year-round work continuing to define the workforce.
In 2026, 86 per cent of respondents reported working full-time, a slight decrease from 88 per cent the previous year. Similarly, 91 per cent indicated they are employed year-round, reinforcing the industry’s reliance on consistent, ongoing work despite its seasonal nature.
Compensation structure also remains largely unchanged. The majority of respondents (83 per cent) reported not being paid an hourly wage—indicating they earn an annual salary—representing a slight decline from 86 per cent in 2025.
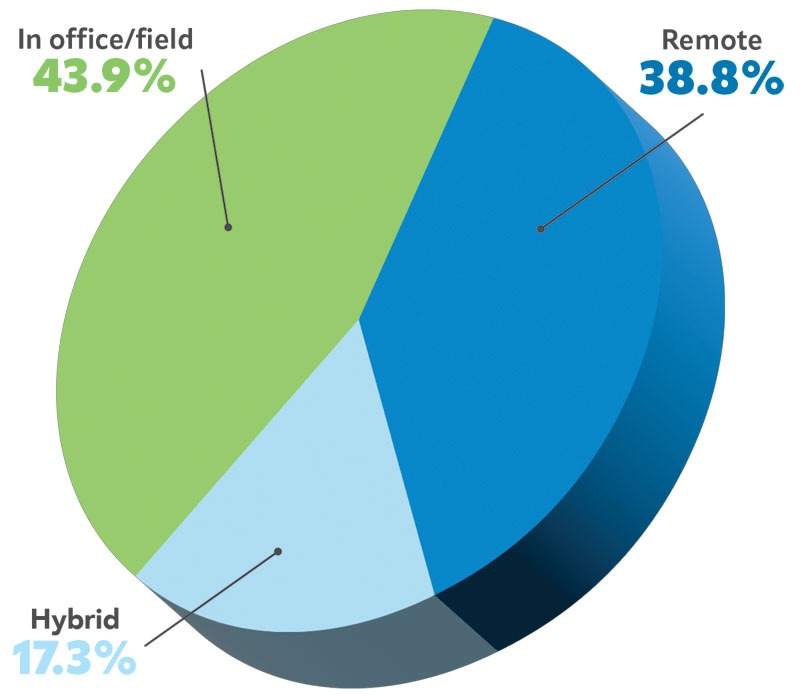
Work arrangements, however, showed a more notable shift. The proportion of respondents working fully remotely declined to 39 per cent, down from 56 per cent the previous year. At the same time, those reporting no remote work increased to 44 per cent, while hybrid arrangements rose to
17 per cent, up from 11 per cent in 2025.
These changes suggest a continued shift toward on-site work environments, particularly in operational and field-based roles where remote work is less practical. While flexibility remains part of the employment landscape, the industry appears to be settling into a more balanced mix of remote, hybrid, and in-person work.
Working hours and benefits
The pool and spa industry continues to be influenced by cyclical factors in working hours, driven by seasonal demand and project timelines. This year indicates a normalization after the heightened activity of recent years.
The largest group of respondents (42 per cent) reported working 41-50 hours per week, the most common workload. Notably, those working 35-40 hours increased to 19 per cent, and those working fewer than 35 hours rose to 13 per cent. In contrast, longer workweeks are declining, with only 19 per cent working 51-60 hours and just seven per cent exceeding 61 hours, suggesting a shift away from extended hours.
Work patterns vary by role: business owners tend to work longer hours due to management demands, while builders and contractors show a more balanced distribution of hours. Overall, the data indicate that while the industry remains busy, workloads are becoming more balanced and manageable, reflecting a transition toward a sustainable pace as workforce pressures ease.
Engaging across multiple social media channels
Social media continues to play a central role in how pool and spa businesses connect with customers and promote their services, with adoption remaining high across several key platforms.
Facebook remains the most widely used platform, with 85 per cent of respondents reporting use. Instagram follows closely at 74 per cent, reinforcing its importance for visual content and project showcasing. LinkedIn (56 per cent) and YouTube (54 per cent) also demonstrate strong engagement, reflecting a growing emphasis on professional networking and video-based content.
Emerging and secondary platforms show more varied adoption. TikTok usage reached 22 per cent, indicating continued experimentation with short-form content, while X (18 per cent), Reddit (15 per cent), and Pinterest (seven per cent) remain more niche channels.
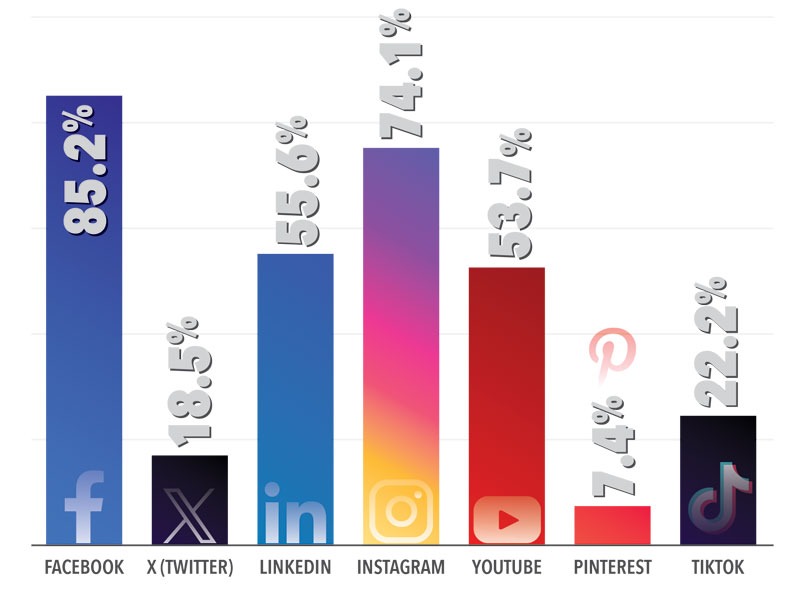
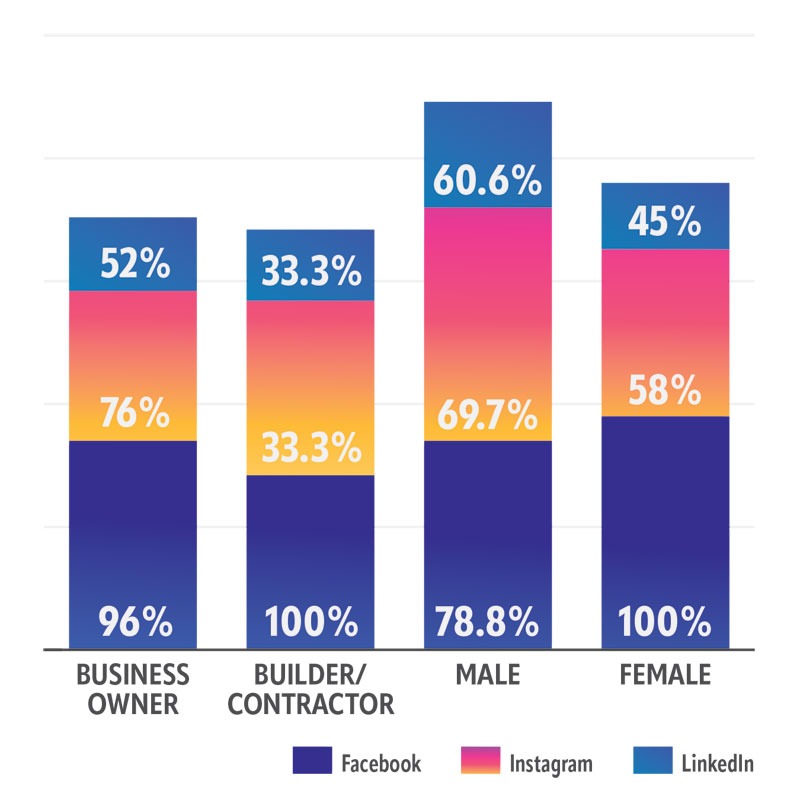
Overall, the data suggests that while core platforms remain dominant, businesses are increasingly diversifying their social media strategies to reach different audiences and support marketing efforts across multiple channels.
Artificial intelligence enters the conversation
In its second year of tracking, artificial intelligence (AI) is beginning to establish a foothold within the pool and spa industry, with adoption slowly increasing as more businesses explore its potential.
This year, 33 per cent of respondents reported using AI, up from approximately 28 per cent in the previous survey. While this shows a notable increase, the majority of respondents—67 per cent—still have not integrated AI into their workflows, suggesting that adoption remains in the early stages.
Among AI users, ChatGPT continues to lead, with the majority of respondents citing it as their primary tool. Other platforms, including Microsoft Copilot, MidJourney, and DALL·E, see more limited use, indicating a landscape still centred around a single, widely adopted solution.
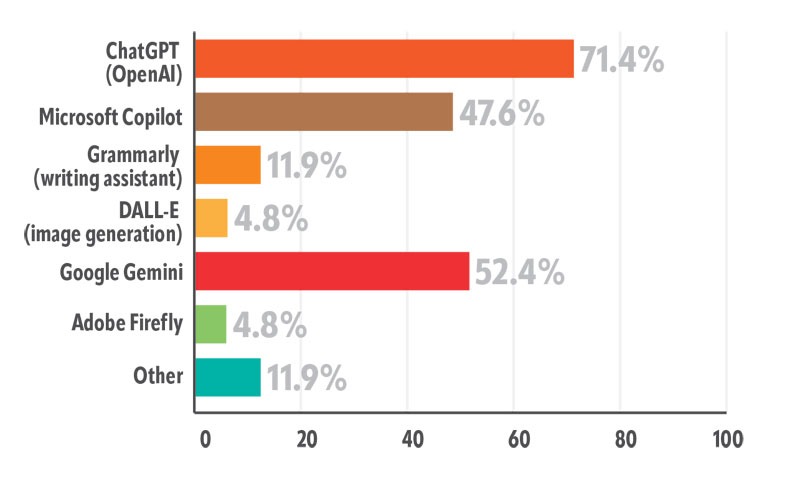
The way AI is used has stayed mostly the same. Writing and content creation still dominate, followed by applications such as research, marketing support, customer service, and image or video creation. More technical uses, such as data analysis and coding, remain less common.
Adoption trends continue to vary by role, with business owners and builder/contractors among the most active users. Overall, the results indicate that while AI usage is expanding, its main focus remains on enhancing efficiency in daily tasks rather than fundamentally transforming operations.
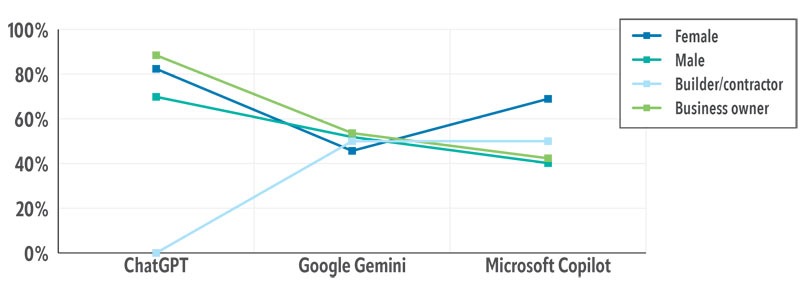
As awareness and familiarity grow, AI is likely to become a more widespread tool across the industry, though its wider impact is
still evolving.
New trends in association engagement
This year’s survey results reveal a varied but distinctly different picture of association participation compared to previous reports. Membership in the Pool & Hot Tub Council of Canada (PHTCC) rose to 63 per cent, up from 58 per cent in the last survey, reinforcing its status as the most widely represented association among respondents. Participation remains notably strong among male respondents and business owners.
In contrast, membership in the Pool & Hot Tub Alliance (PHTA) decreased slightly to 15 per cent, down from
17 per cent last year, reflecting relatively stable yet modest participation overall.
Membership in the Association des commerçants de piscines du Québec (ACPQ) rose to 10 per cent, more than doubling from five per cent in the previous survey. This represents the strongest year-over-year increase among the tracked associations and indicates renewed engagement from Quebec-based respondents.
The Independent Pool Group (IPG) decreased to 14 per cent from 24 per cent last year. This marks the most significant decline in the category and indicates weaker participation among respondents in 2026 compared to the previous survey.
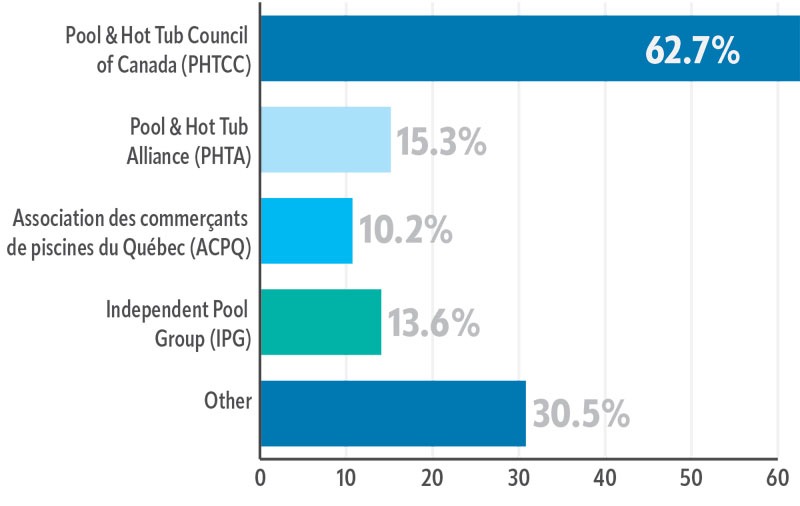
Overall, the findings suggest a reshuffling in engagement levels rather than a consistent trend. PHTCC strengthened, ACPQ gained ground, PHTA remained relatively stable, and IPG declined, indicating that respondents are not moving uniformly across
all organizations.
What is the biggest frustration with your job?
- Finding and retaining qualified staff
- Managing employees and performance issues
- Pay not matching responsibilities
- Dealing with difficult customers
- Increased competition (online and unqualified providers)
- Customer pushback on pricing and costs
- Unclear or shifting job roles
- Pressures of business ownership and leadership
Trends in job satisfaction
When asked to compare their current level of job satisfaction with five years ago, responses indicate a largely stable outlook across the industry.
Nearly half of respondents (46 per cent) reported feeling equally satisfied, while 30 per cent indicated they are more satisfied. At the same time, 24 per cent reported lower satisfaction levels.
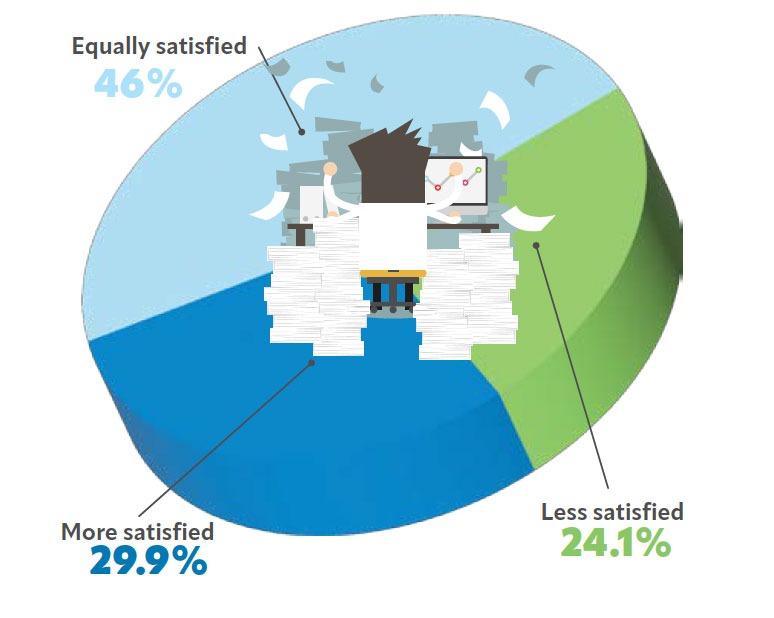
These results suggest that, while overall sentiment remains steady, a meaningful portion of the workforce is still experiencing increased pressure or changing expectations in their roles. The balance between those reporting higher and lower satisfaction highlights an industry that is neither improving nor declining significantly in this area, but rather holding relatively consistent.
Overall, the findings indicate that job satisfaction remains stable, though not without underlying challenges, as professionals continue to navigate evolving market conditions and workplace demands.
Key characteristics of industry employers
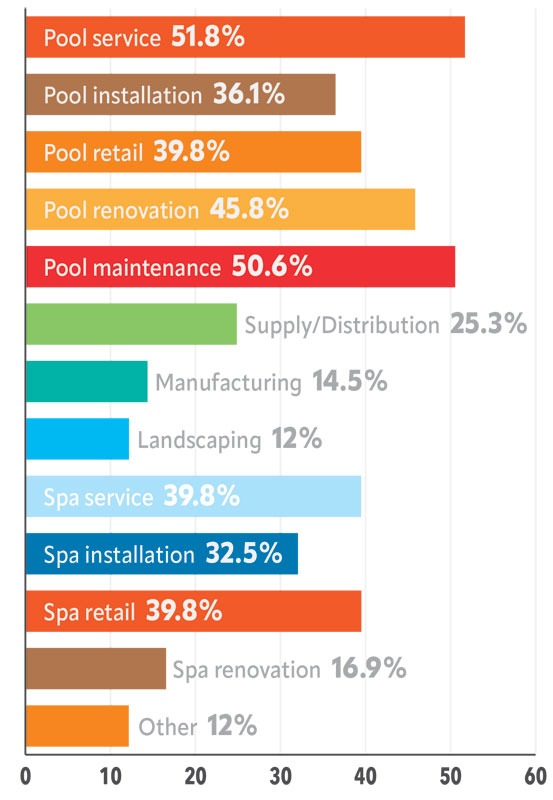
This year’s survey highlights a shift in the pool and spa industry, with a decrease in the smallest businesses and modest growth among larger firms. Companies with one to five employees comprise 32 per cent of respondents, down from 41 per cent in 2025. Meanwhile, firms with six to 10 employees increased to 18 per cent (up from 13 per cent), while mid-sized companies (11 to 20 employees) remained stable at 12 per cent.
Larger firms also saw gains, with those employing 41 to 99 employees rising to 13 per cent and firms with 100 to 500 employees increasing to 10 per cent. This indicates a slight expansion in company sizes rather than the continued consolidation of smaller businesses.
Project values have shifted as well, with 38 per cent of respondents reporting average project values of $30,000 to $59,999, up from 30 per cent in 2025. Meanwhile, mid-range projects ($100,000 to $299,999) dropped to 14 per cent, down from 21 per cent. In contrast, projects exceeding $500,000 rose to 27 per cent, up from 20 per cent in 2025.
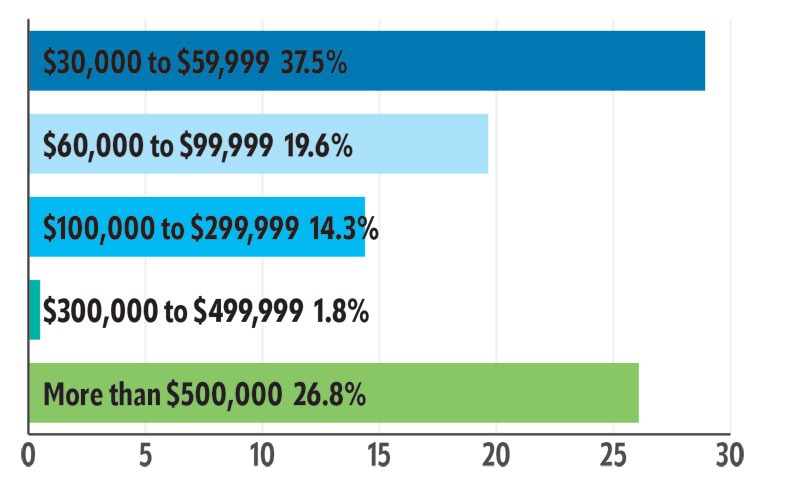
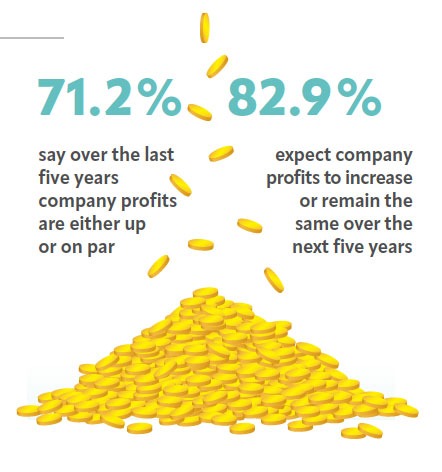
These trends suggest a market divided by economic pressures, with demand for smaller, cost-effective projects rising alongside continued investment from higher-end clients in premium builds.
Sign up for our newsletter
Get all the latest news and features from Pool & Spa Marketing. Submit your email below to get our twice-monthly newsletter.
Products


Read the Latest Issue